Demand Forecast
Demand Forecast allows you to view, upload, and manage demand forecasts for products over time.
Overview
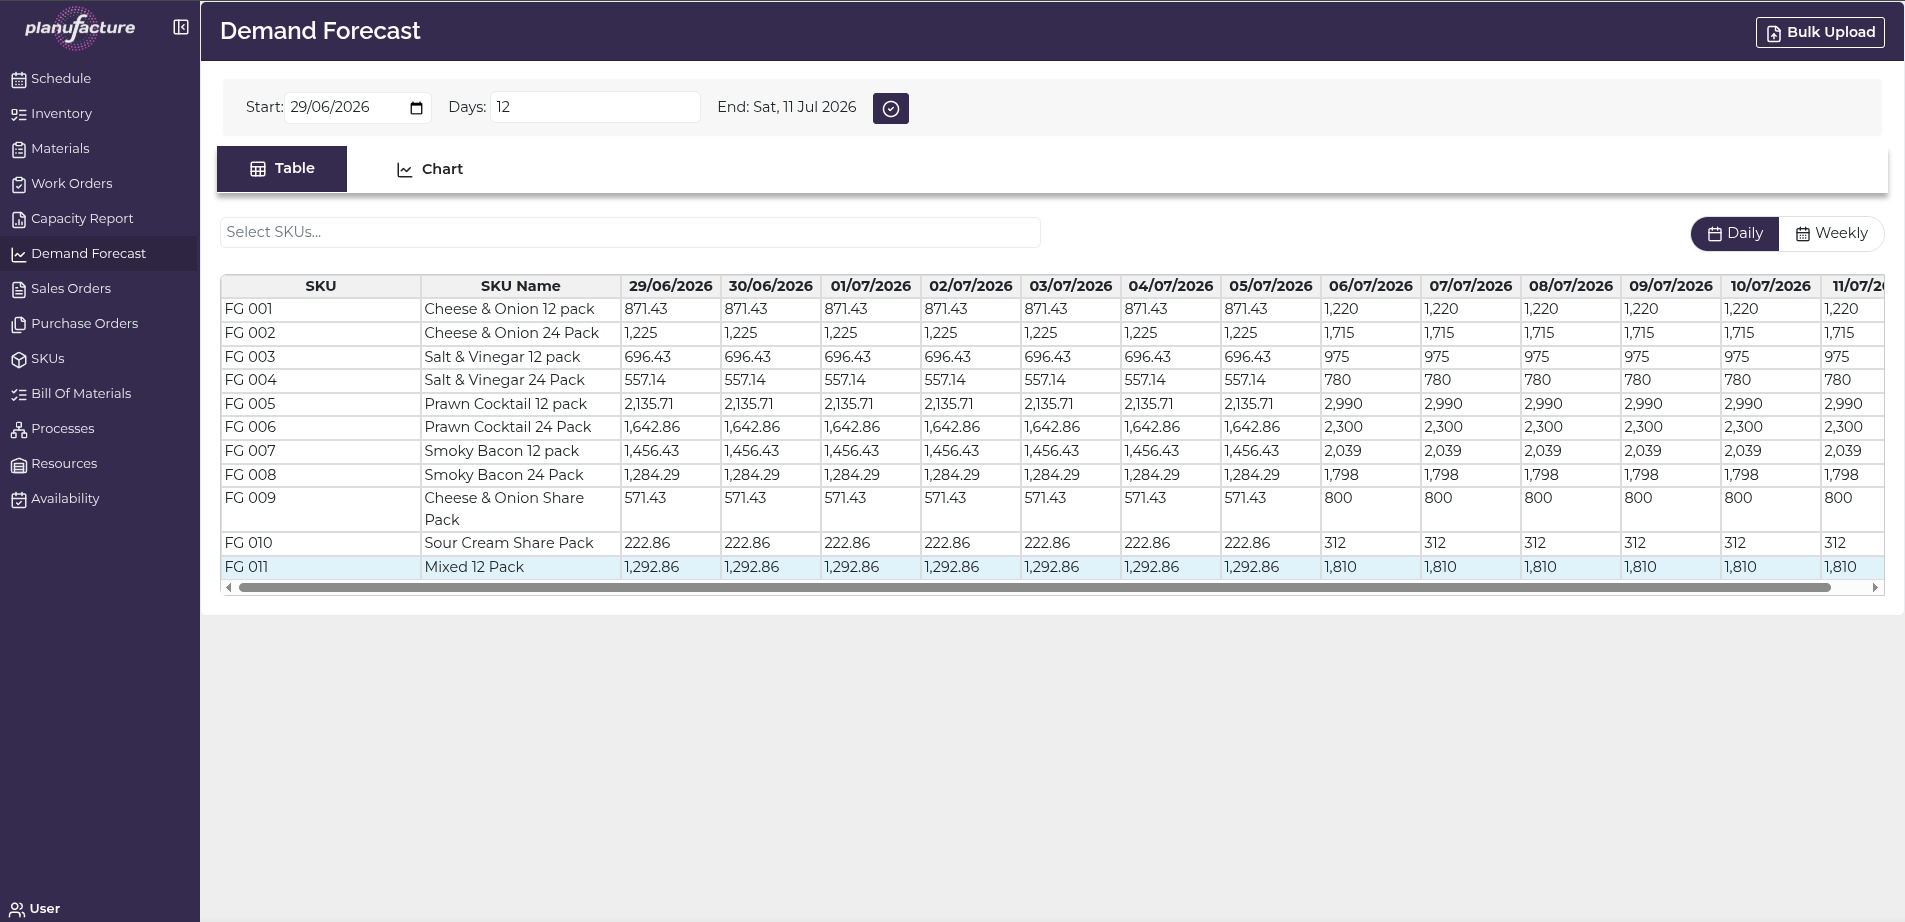
- Table view: Forecasted demand by SKU and date
- Chart view: Visual representation of demand trends
- Bulk upload: Import forecasts from files
- Two upload types: Time Series or Average forecasts
Date Range Controls
- Start: Beginning date for forecast view
- Days: Number of days to display (e.g., 12 days)
- End Sat: Calculated end date
- Date picker with calendar interface
View Tabs
Table Tab
Shows forecasted demand in tabular format:
Columns:
- SKU: Product code
- SKU Name: Product description
- Date Columns: Forecasted quantity for each date (e.g., 29/06/2026, 30/06/2026, 01/07/2026...)
Each cell shows the forecasted demand quantity for that SKU on that date.
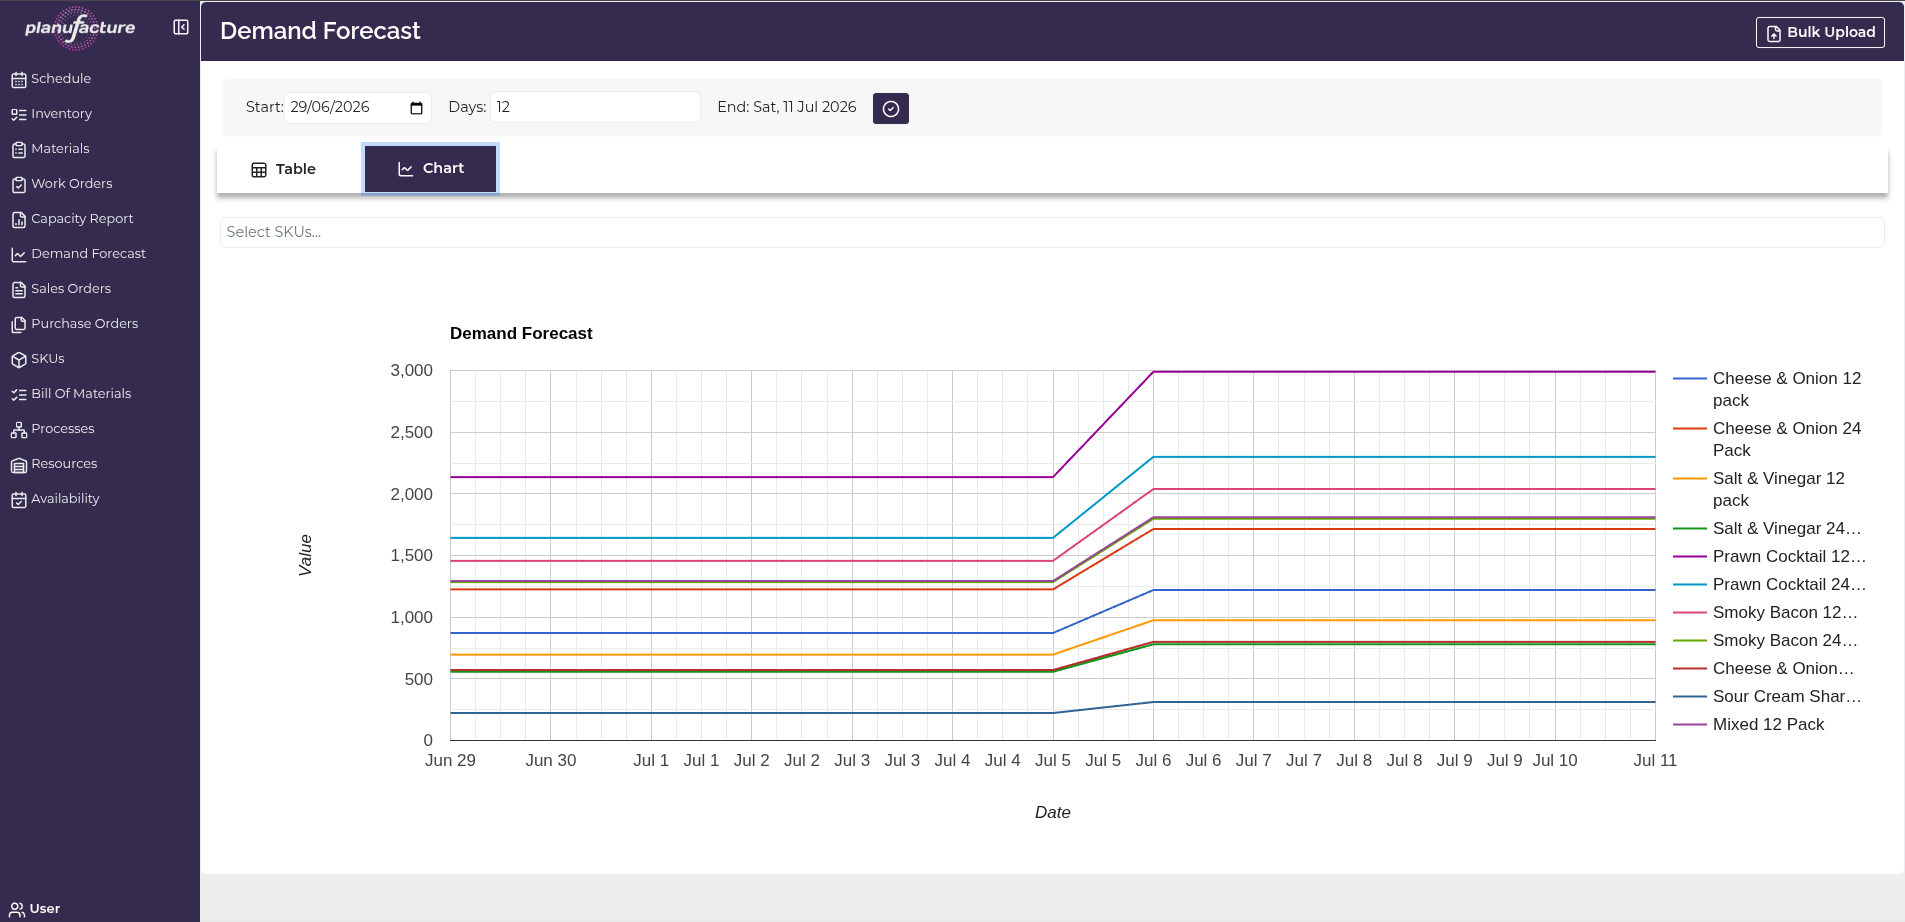
Chart Tab
Visual representation of demand forecasts:
Chart Features:
- X-axis: Timeline (dates)
- Y-axis: Value (quantity)
- Multiple lines: Each SKU shown as a separate colored line
- Legend: Shows which color represents which SKU
- Interactive: Hover to see exact values
Reading the chart:
- Horizontal lines indicate steady demand
- Upward slopes show increasing demand
- Downward slopes show decreasing demand
- Step changes indicate demand shifts
SKU Filter
Select SKUs dropdown:
- Filter which products to display
- Search box to find specific SKUs
- Select multiple SKUs
- Useful for focusing on specific products
View Toggle
Daily / Weekly buttons:
- Daily: Shows demand by individual days
- Weekly: Aggregates demand by week
- Toggle between views for different planning horizons
Bulk Upload
Bulk Upload button (top right):
- Opens upload workflow
- Import demand forecasts from files
- Two upload types available
Choose Demand Forecast Upload Type
Two options for uploading forecasts:
Time Series Forecast
Description: Upload demand forecasts with specific quantities for each time period. Each column represents a date with its corresponding forecast quantity.
File format: SKU, Date1, Date2, Date3...
Example table structure:
- Column 1: SKU code
- Column 2: Date 1 (e.g., 21/10/2025) with quantity
- Column 3: Date 2 (e.g., 27/10/2025) with quantity
- Additional date columns as needed
Button: Choose Time Series Forecast
Average Forecast
Description: Upload demand forecasts with a single quantity per SKU. The system will distribute this across multiple time periods based on your configuration.
File format: SKU, Quantity
Example table structure:
- Column 1: SKU code
- Column 2: Quantity (e.g., 20,321)
- System distributes across periods (e.g., Weekly)
Button: Choose Average Forecast
Upload Time Series Demand Forecasts
4-step wizard:
Step 1: File Upload
Upload your Time Series Data File
- Drag and drop area
- Or click to select a file
- Next button to proceed
Step 2: Select Data
Select the data you would like to import
Select Sheet:
- Dropdown to choose worksheet (e.g., "Timeseries-Forecast")
Preview: Table showing imported data:
- SKU ID: Product codes
- Name: Product names
- Date columns: Forecasted quantities by date (1/6/2026, 8/6/2026, 15/6/2026, etc.)
Preview allows verification before import.
Step 3: Fields & Date Configuration
Field Mapping Options & Configure Date Format and Frequency
Map Required Fields:
System Fields → Your Data Fields
- SKU: Dropdown to select field (e.g., "Please select a field...")
- First Date Column: Dropdown to select field
Date Format:
- Format selector (e.g., DD/MM/YYYY)
- "Select the date format used in your spreadsheet columns"
Forecast Frequency:
- Dropdown (e.g., "Weekly")
- "How frequently are the forecasts in your data?"
Buttons:
- Prev: Go back to previous step
- Next: Continue to next step
Step 4: Edit and Save
Edit and Save
Preview: Your time series data will be converted to individual forecast entries. Each cell with a quantity will create a separate demand forecast record for that SKU and date.
Preview table:
- SKU: Product codes
- Date columns: Forecasted quantities
- Shows exactly what will be imported
Buttons:
- Prev: Go back to edit configuration
- Save: Import the forecasts
Common Workflows
Viewing Current Forecasts
- Navigate to Demand Forecast
- Select Table tab to see detailed numbers
- Or select Chart tab for visual trends
- Use Select SKUs to filter specific products
- Adjust date range to focus on planning period
Analyzing Demand Trends
- Select Chart tab
- Choose SKUs to compare
- Look for:
- Seasonal patterns
- Growth trends
- Demand spikes
- Declining products
- Use insights for capacity and inventory planning
Uploading Time Series Forecasts
- Click Bulk Upload button
- Select Time Series Forecast
- Step 1: Upload file with SKU, Date1, Date2, Date3... format
- Step 2: Select worksheet and preview data
- Step 3: Map SKU and First Date Column fields
- Step 3: Configure date format (e.g., DD/MM/YYYY) and frequency (e.g., Weekly)
- Step 4: Review preview and click Save
Uploading Average Forecasts
- Click Bulk Upload button
- Select Average Forecast
- Upload file with SKU and Quantity columns
- System distributes quantity across periods based on configuration
- Useful for simple, steady-state forecasts
Switching Between Daily and Weekly Views
- Use Daily view for detailed short-term planning
- Use Weekly view for high-level capacity planning
- Weekly aggregates daily forecasts for easier analysis
Understanding Forecasts
Forecast uses:
- Production planning: Schedule work orders to meet demand
- Inventory planning: Maintain appropriate stock levels
- Capacity planning: Ensure sufficient production capacity
- Material planning: Order materials to support production
- Sales planning: Align sales efforts with production capability
Forecast accuracy:
- Regularly update forecasts based on actual demand
- Compare forecasts to actuals to improve accuracy
- Adjust for seasonality, promotions, and market changes
Tips
- Update forecasts regularly to reflect changing market conditions
- Use Chart view to quickly spot trends and anomalies
- Time Series forecasts provide more granular control for variable demand
- Average forecasts work well for stable, predictable products
- Weekly view is useful for strategic planning
- Daily view helps with tactical scheduling
- Filter by Select SKUs to focus on key products or problem areas
- Review forecasts before uploading to catch data errors
- Use date format configuration to match your spreadsheet format
- Forecast frequency (Daily/Weekly) should match your planning cycle
Related
- Schedule: Auto-scheduler uses forecasts to plan production
- Work Orders: Create work orders to meet forecasted demand
- Materials: Material requirements driven by forecast-based production plans
- Inventory: Stock projections based on forecasted consumption
- Capacity Report: Compare forecasted demand against available capacity